

Docs / Tutorials
Tutorial: blocks that work together
Write a worker block in Python and a view in JavaScript, and connect them: a CPU benchmark shown as text, live values while it runs, a Stop button that talks back to it, and blocks on two workers feeding one comparison.
This tutorial builds four small examples, each one adding a way for blocks to talk to each other. You write the code of two kinds of block: worker blocks in Python, which run on your workers, and views in JavaScript, which run in the browser. Every piece of code below was run as written on EsaSim, and the pictures are of those runs.
- A CPU benchmark shown as text: a worker block times an operation repeated 10,000 times and a view of your own prints the result.
- Watch it live: the benchmark sends each round as it finishes, and a second view shows the rounds as they come in.
- A button that talks back: a Stop button in the view tells the running block to finish early.
- From one worker block to another: two benchmarks on two workers feed a block that compares them, and EsaSim's own Table and Chart views show the comparison.
What you need: a workspace with at least one worker (install the worker) with Run code from projects turned on in its Worker settings, and Python 3 on it. The examples use only Python's standard library, so there is nothing to install. Allow about 20 minutes.
How blocks talk to each other
A block never calls another block directly. Each block reads what comes in through its inputs, and what it makes leaves through its outputs. EsaSim carries everything in between: it gives a worker block its inputs on the worker, keeps the results, relays live values and messages, and hands views what is wired into them. This is why a block on a worker in your lab can feed a view in your browser at home, or a block on another worker.
| Route | The block that sends | The block that receives | When it arrives |
|---|---|---|---|
| Result files | Returns a dict from run(ctx) (it becomes result.json), or writes files with ctx.write_json, ctx.write_text or ctx.output | A view reads them with ctx.json, ctx.rows, ctx.text or ctx.files | When the worker block has finished |
| Live values | ctx.telemetry("channel", data) while the block runs | A view with an input of type Live values (stream): ctx.input("port").stream | Within about a second |
| Messages | A view: ctx.send("channel", data) | The running worker blocks: ctx.messages("channel") | At the block's next check, while the run goes on |
| Output files | A worker block's output, as above | The next worker block: ctx.inputs["port"], a list of files | Before the next block starts; on another worker if it runs elsewhere |
The type of each port decides what can be wired to it: the editor only lets you connect an output to an input that accepts it (the port types are listed in Build your own blocks).
Example 1: a CPU benchmark shown as text
The worker block runs a square root and a multiply-add 10,000 times, times the loop over a few rounds, and returns what it measured. The view takes that result and writes it out as text.
Step 1: the worker block
- Open Projects > Blocks and choose New worker block (in a flow: Add block > Make a block).
- Name it CPU benchmark, choose the gauge icon and write one line in What it does, such as Times a square root and a multiply-add repeated many times.
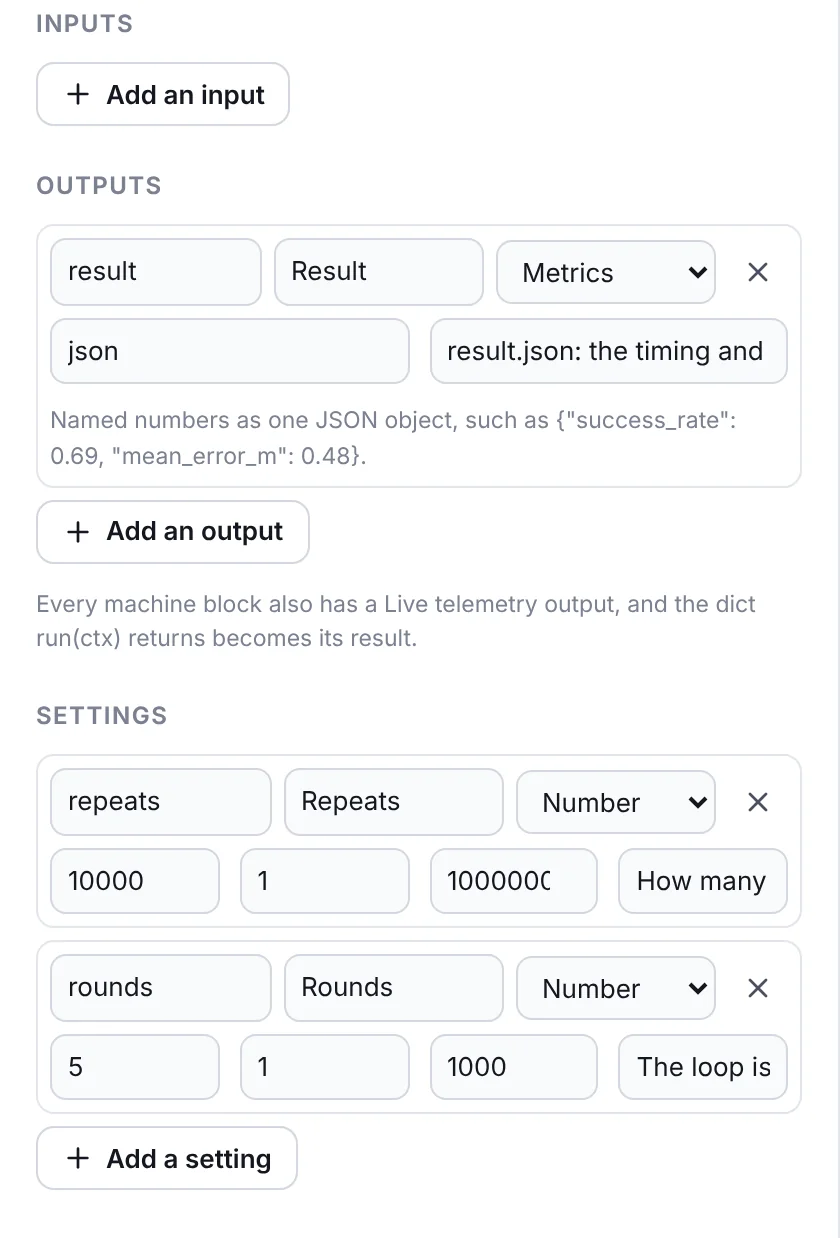
- Under Outputs, add one with id
result, label Result, type Metrics and formatjson. The id is the name the code uses; an output namedresultreceives the dict thatrun(ctx)returns. - Under Settings, add two numbers:
repeats(Repeats, default 10000, from 1 to 100000000) androunds(Rounds, default 5, from 1 to 1000). They appear on the block in the flow, and the code reads them fromctx.params. - Replace the starter code with the code below, press Verify, then Save block.
import math
import platform
import time


def run(ctx):
    repeats = int(ctx.params.get("repeats", 10000))     # how many times the operation runs
    rounds = int(ctx.params.get("rounds", 5))           # the whole loop, timed this many times

    times = []
    for r in range(rounds):
        start = time.perf_counter()
        x = 0.0
        for i in range(repeats):                        # the operation we measure
            x += math.sqrt(i) * 1.000001
        times.append(time.perf_counter() - start)
        ctx.progress(100 * (r + 1) // rounds, f"round {r + 1} of {rounds}")
        print(f"round {r + 1}: {times[-1] * 1000:.2f} ms")

    best = min(times)
    return {                                            # becomes result.json on the "result" output
        "machine": platform.node(),
        "cpu": platform.processor() or platform.machine(),
        "python": platform.python_version(),
        "repeats": repeats,
        "rounds": rounds,
        "best_ms": round(best * 1000, 3),
        "mean_ms": round(sum(times) / len(times) * 1000, 3),
        "ops_per_second": round(repeats / best),
}ctx.paramsholds the block's settings, with the values chosen in the flow.ctx.progress(pct, note)moves the progress bar of the block on the grid and of the run.print(...)writes a line in the run's log (the editor's console, Log tab).- The dict returned at the end is written as
result.jsonon theresultoutput. Keep it to numbers, text, lists and dicts: it is saved as JSON.
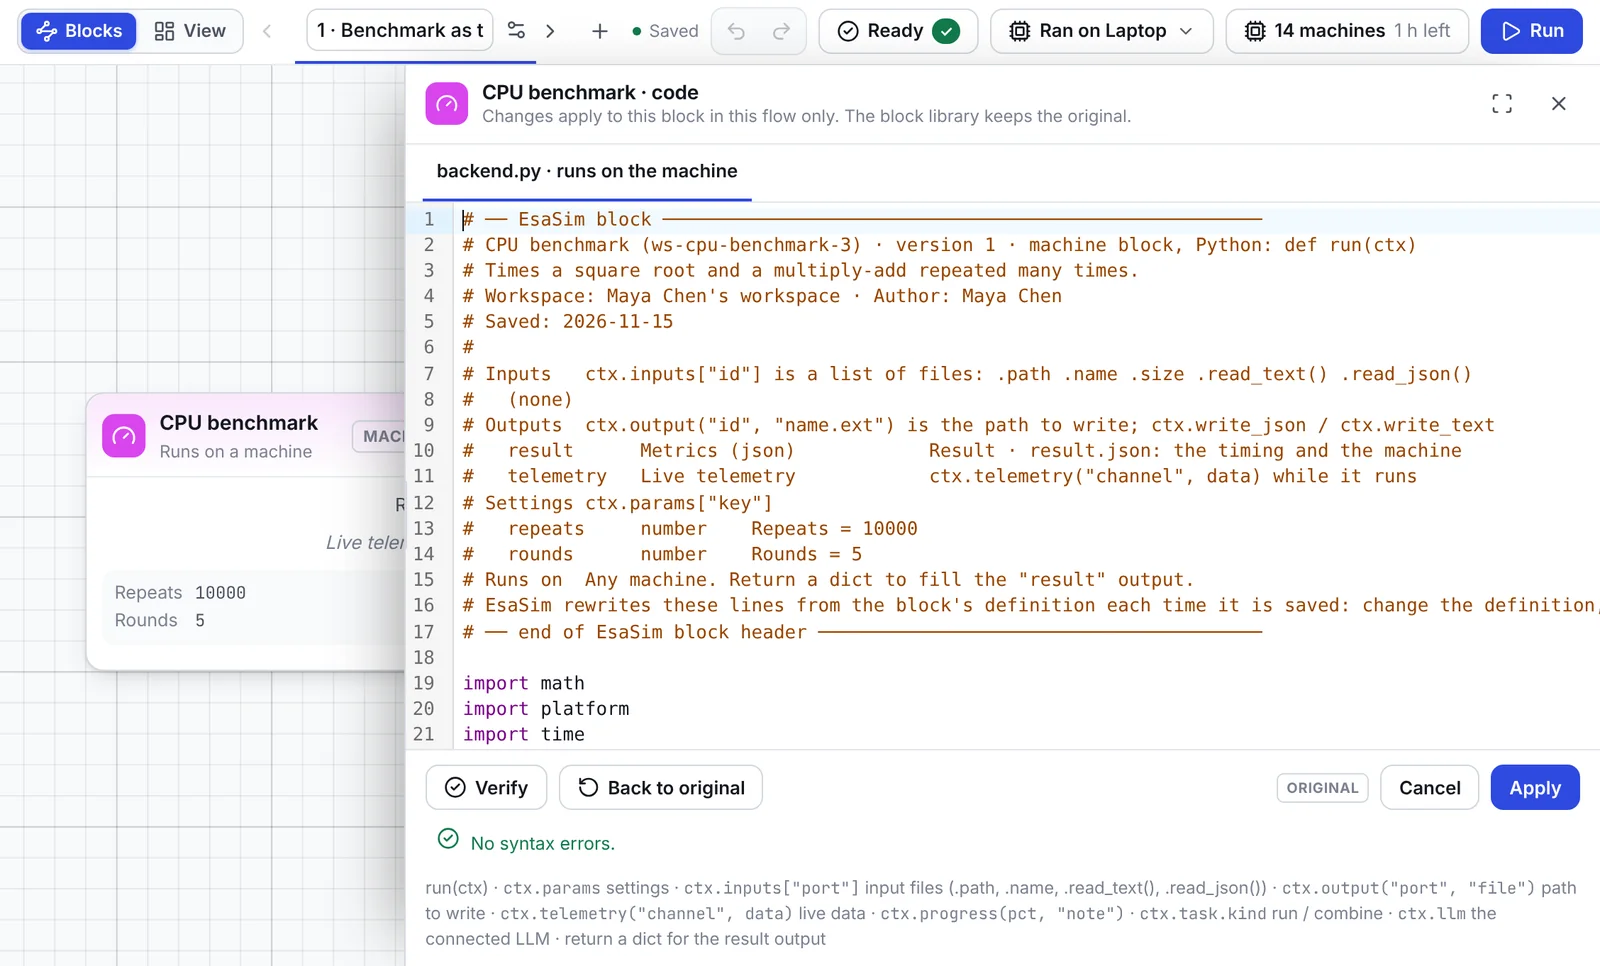
Step 2: the view
- Choose New view. Name it Benchmark text with the text icon.
- Under Inputs, add one with id
bench, label Benchmark, type Metrics and formatjson. A view has no outputs: it shows what comes in. - Replace the starter code with the code below, Verify and Save block.
function render(ctx) {
  ctx.el.innerHTML = '<div class="viz-pad"><h3 class="viz-h">CPU benchmark</h3><pre class="out"></pre></div>';
  var out = ctx.el.querySelector('.out');

  function draw() {
    ctx.json('bench').then(function (r) {          // result.json of the benchmark, parsed
      if (!r) { out.textContent = 'Waiting for the benchmark…'; return; }
      out.textContent =
        'Machine          ' + r.machine + ' (' + r.cpu + ', Python ' + r.python + ')\n' +
        'Operation        sqrt + multiply-add, ' + r.repeats.toLocaleString() + ' times\n' +
        'Best of ' + r.rounds + ' rounds  ' + r.best_ms + ' ms\n' +
        'Mean             ' + r.mean_ms + ' ms\n' +
        'Speed            ' + r.ops_per_second.toLocaleString() + ' operations per second';
    });
  }
  ctx.on('update', draw);                           // new data: draw again
  draw();
}render(ctx)runs once, when the view appears.ctx.elis the element it draws into; the classesviz-padandviz-hgive it the spacing and title style of EsaSim's own views, in the light and dark themes.ctx.json("bench")reads the first JSON file that arrived on thebenchinput, parsed. It returns a promise, andnullwhile nothing has arrived.ctx.on("update", draw)callsdrawagain each time new data reaches the view: when a run finishes, when you pick another run, or when a live value comes in.- Views run in a sandboxed frame that cannot reach the dashboard or the network: all data comes in through
ctx.
In the code panel, Preview shows Waiting for the benchmark…: the preview's sample data does not fill an input named bench. The real data comes with the first run.
Step 3: wire them and run
- In a project, open Blueprint, make a new flow, and add CPU benchmark and Benchmark text from the My blocks category of the block menu.
- Drag from the Result output of the benchmark to the Benchmark input of the view.
- Press Run, then Start. When the block is done, open View.
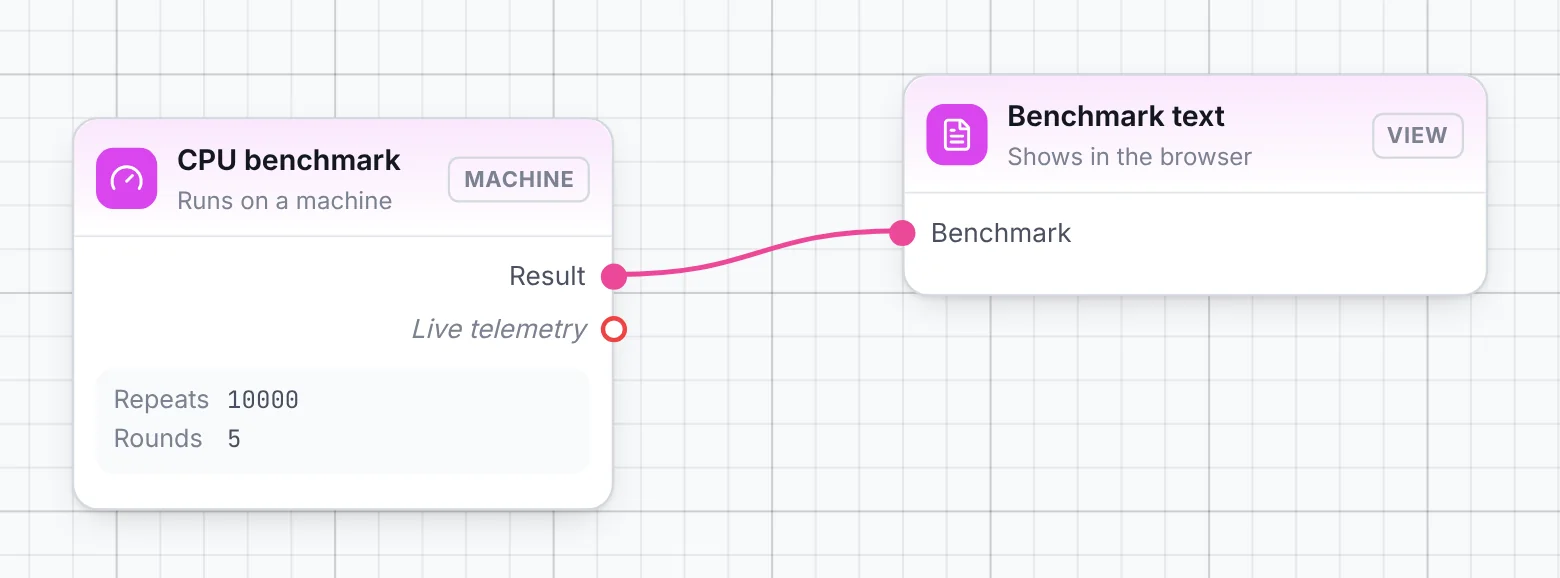
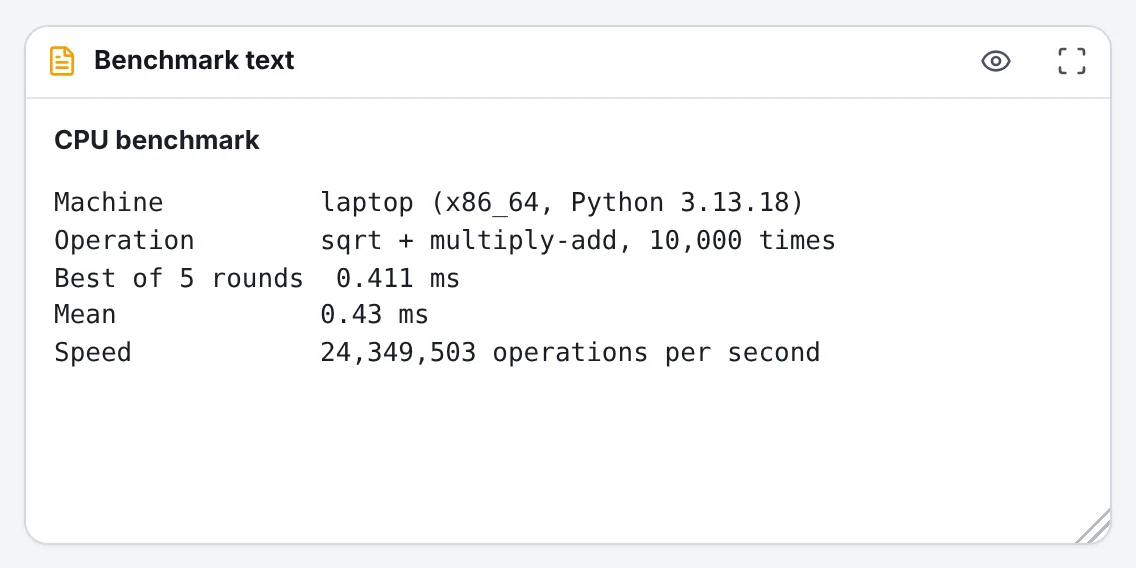
What happened on the way: EsaSim chose a worker for the benchmark (the run panel says which, and so does the Ran on menu), the worker on that computer fetched the block's code and ran run(ctx) with its settings, and when it returned, the worker sent result.json to EsaSim. The page saw the run finish, gave the file to the view, and ctx.on("update") drew it.
Example 2: watch it live
Results arrive when a block has finished. For a block that runs for minutes or hours you want to see it working: that is what live values are for. The benchmark will send each round as it ends, and a new view will list the rounds as they arrive.
The worker block sends each round
Open the CPU benchmark in Projects > Blocks, choose Edit, and add a third number setting, pause (Pause between rounds (s), default 0.5, from 0 to 60), so that there is time to watch. Inside the for loop, after ctx.progress, add:
ctx.telemetry("round", {                        # live: reaches the views within a second
    "round": r + 1,
    "ms": round(times[-1] * 1000, 3),
    "ops_per_second": round(repeats / times[-1]),
})
time.sleep(pause)
and read the setting with the others: pause = float(ctx.params.get("pause", 0.5)). Saving makes version 2 of the block; flows using it get it on their next run.
ctx.telemetry(channel, data)sends one item on a channel you name.datais a number, a dict or a list, up to 60 KB. Send as often as you like: the page collects the items and passes them on about once a second.- Live values are also shown in the editor's console (Live tab) while the run goes on, and are kept with the run, so a view shows them again when you open an earlier run.
A view that takes live values
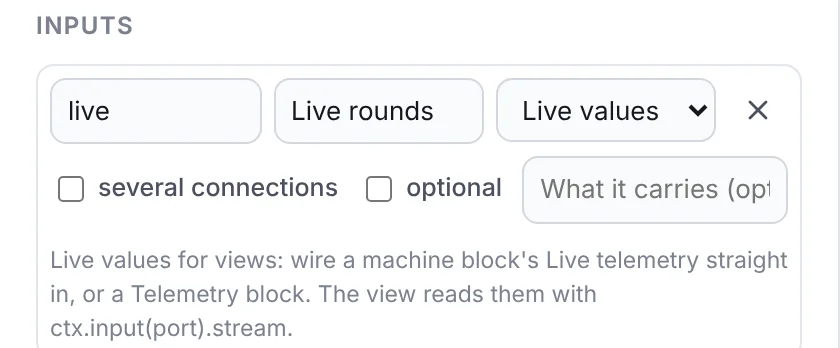
Make a view Benchmark live with one input: id live, label Live rounds, type Live values (stream).
function render(ctx) {
  ctx.el.innerHTML = '<div class="viz-pad"><h3 class="viz-h">Rounds as they finish</h3><pre class="out"></pre></div>';
  var out = ctx.el.querySelector('.out');

  function draw() {
    var rounds = ctx.input('live').stream                       // every live item so far, oldest first
      .filter(function (it) { return it.channel === 'round'; })
      .map(function (it) { return it.data; });                  // what the block passed to ctx.telemetry
    if (!rounds.length) { out.textContent = 'Waiting for the first round…'; return; }
    var slowest = Math.max.apply(null, rounds.map(function (d) { return d.ms; }));
    out.textContent = rounds.map(function (d) {
      var bar = '█'.repeat(Math.max(1, Math.round(30 * d.ms / slowest)));
      return 'round ' + String(d.round).padStart(2) + '  ' + d.ms.toFixed(2).padStart(7) + ' ms  ' + bar;
    }).join('\n');
  }
  ctx.on('update', draw);                                        // runs at each new item
  draw();
}ctx.input("live").streamis every live item received so far, oldest first. Each item is{ channel, t, node, data }:datais exactly what the block passed toctx.telemetry,tthe time it was sent (seconds since 1970) andnodethe block that sent it.- Filtering by
channellets one block send several kinds of value (a progress channel, a pose channel…) and each view pick its own. ctx.rows("live")gives the same items as flat rows ({t, channel, round, ms, ops_per_second}), which is handy for tables and charts.
In the flow, wire the benchmark's Live telemetry output to Live rounds, keep Result wired to Benchmark text, and run.
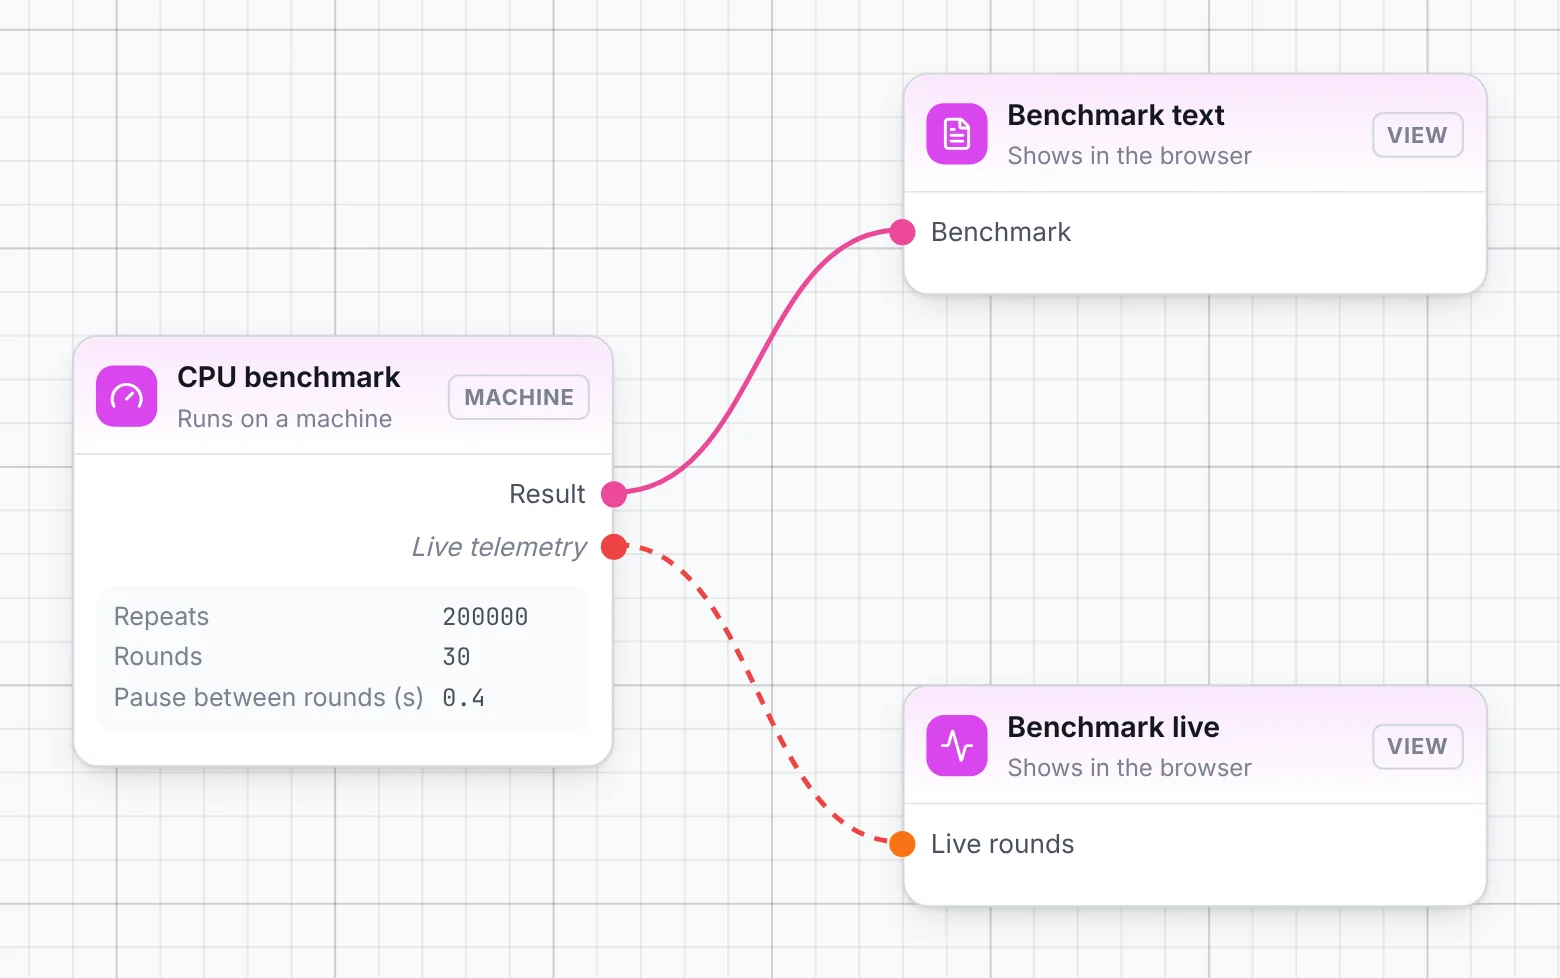
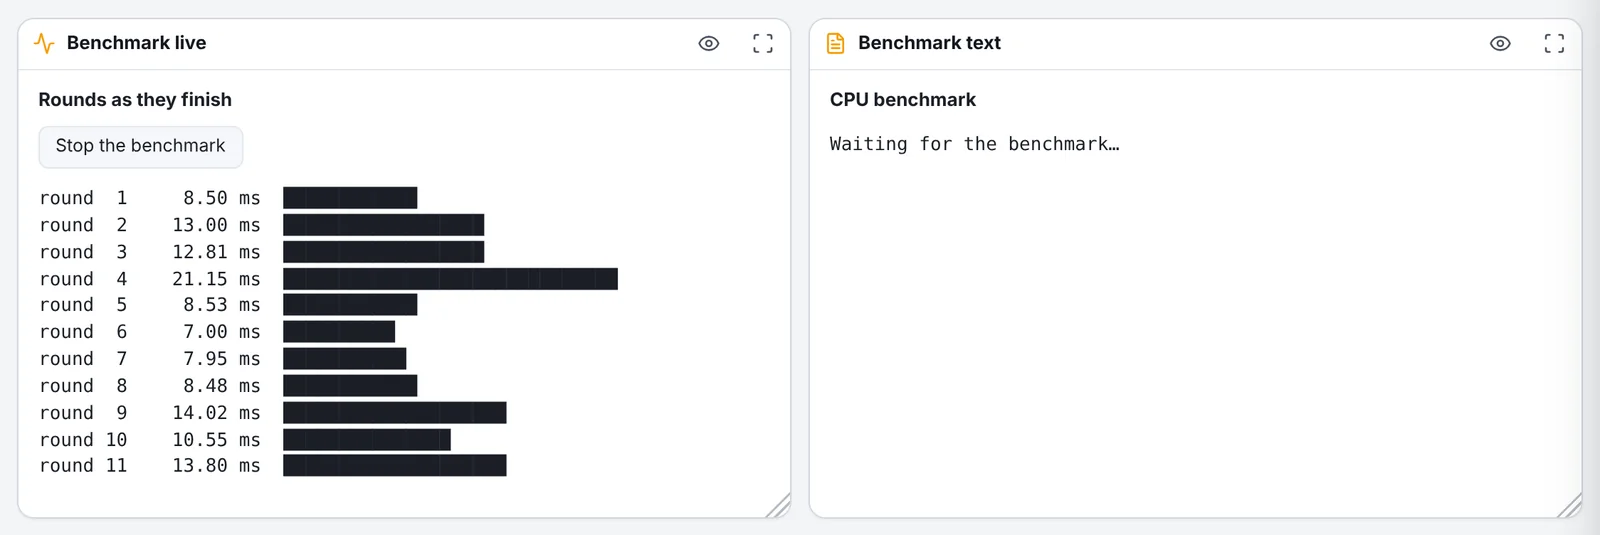
For charts you do not need a view of your own: EsaSim's Chart view takes the same wire. Set its Stream channel to round, Horizontal axis to round and Values to ms. The Telemetry block sits between a worker block and views when you want to keep only some channels, read several blocks at once, or read more or less often.
Example 3: a button that talks back
A view can also send to the running blocks. Here a Stop button asks the benchmark to finish after the current round and still return its result: something a cancelled run would not do.
The view sends a message
Change Benchmark live to the code below. It adds a button, sends {"stop": true} on the channel control when it is clicked, and enables the button only while the run goes on.
function render(ctx) {
  ctx.el.innerHTML = '<div class="viz-pad"><h3 class="viz-h">Rounds as they finish</h3>'
    + '<div class="viz-row"><button class="viz-btn stop">Stop the benchmark</button> <span class="viz-muted note"></span></div>'
    + '<pre class="out"></pre></div>';
  var out = ctx.el.querySelector('.out'), btn = ctx.el.querySelector('.stop'), note = ctx.el.querySelector('.note');

  btn.addEventListener('click', function () {
    ctx.send('control', { stop: true }).then(                    // to the running blocks: ctx.messages("control")
      function () { note.textContent = 'Sent: it stops after this round.'; },
      function (err) { note.textContent = err.message; });
  });
  function syncButton() { btn.disabled = !ctx.run.active; }     // only while the run goes on
  ctx.on('run', syncButton);
  syncButton();

  function draw() {
    var rounds = ctx.input('live').stream
      .filter(function (it) { return it.channel === 'round'; })
      .map(function (it) { return it.data; });
    if (!rounds.length) { out.textContent = 'Waiting for the first round…'; return; }
    var slowest = Math.max.apply(null, rounds.map(function (d) { return d.ms; }));
    out.textContent = rounds.map(function (d) {
      var bar = '█'.repeat(Math.max(1, Math.round(30 * d.ms / slowest)));
      return 'round ' + String(d.round).padStart(2) + '  ' + d.ms.toFixed(2).padStart(7) + ' ms  ' + bar;
    }).join('\n');
  }
  ctx.on('update', draw);
  draw();
}
ctx.send(channel, data)sends JSON data (up to 512 KB) to the running worker blocks of the run shown, all of them or only one withctx.send(channel, data, { node: "bench" }). Its promise fails with the reason when the run has ended.ctx.run.activetells whether the run shown is still going on, andctx.on("run", fn)callsfnwhen that changes.
The worker block reads it
Inside the benchmark's loop, before the pause:
stop = any(m["data"].get("stop") for m in ctx.messages("control"))   # sent by a view
if stop:
    print(f"Stopped from the dashboard after round {r + 1}")
breakctx.messages(channel)returns the messages that arrived on that channel since the last call, oldest first, as dicts withchannel,dataandt. It does not wait: check it where your code can stop or change course, here once per round.- To wait for a message instead, use
ctx.messages(channel, wait=5)(up to 5 seconds) orctx.message(channel, timeout), which returns the next one.
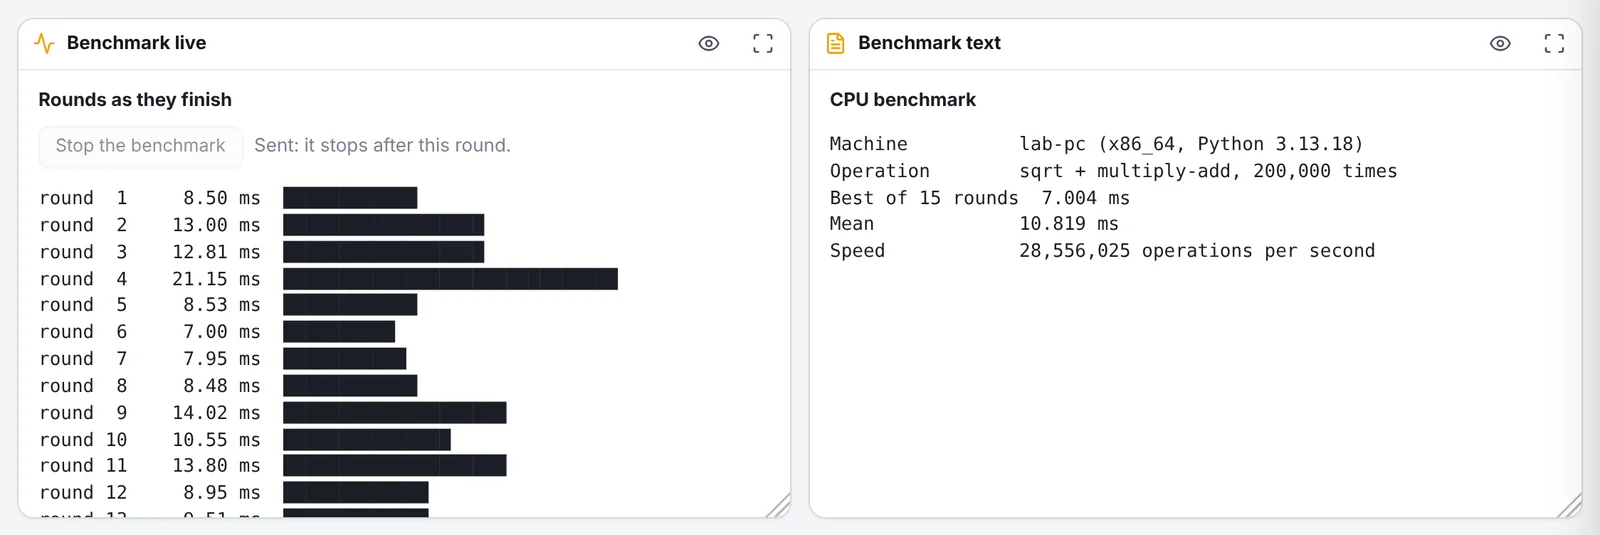
The whole worker block, version 2, with examples 2 and 3 in it:
import math
import platform
import time


def run(ctx):
    repeats = int(ctx.params.get("repeats", 10000))     # how many times the operation runs
    rounds = int(ctx.params.get("rounds", 5))           # the whole loop, timed this many times
    pause = float(ctx.params.get("pause", 0.5))         # seconds between rounds, to watch it live

    times = []
    for r in range(rounds):
        start = time.perf_counter()
        x = 0.0
        for i in range(repeats):                        # the operation we measure
            x += math.sqrt(i) * 1.000001
        times.append(time.perf_counter() - start)
        ctx.progress(100 * (r + 1) // rounds, f"round {r + 1} of {rounds}")
        ctx.telemetry("round", {                        # live: reaches the views within a second
            "round": r + 1,
            "ms": round(times[-1] * 1000, 3),
            "ops_per_second": round(repeats / times[-1]),
        })

        stop = any(m["data"].get("stop") for m in ctx.messages("control"))   # sent by a view
        if stop:
            print(f"Stopped from the dashboard after round {r + 1}")
            break
        time.sleep(pause)

    best = min(times)
    return {                                            # becomes result.json on the "result" output
        "machine": platform.node(),
        "cpu": platform.processor() or platform.machine(),
        "python": platform.python_version(),
        "repeats": repeats,
        "rounds": len(times),
        "best_ms": round(best * 1000, 3),
        "mean_ms": round(sum(times) / len(times) * 1000, 3),
        "ops_per_second": round(repeats / best),
    }
Example 4: from one worker block to another
Worker blocks pass files to each other. Here two CPU benchmarks run on two different workers, and a third block puts their results in one table, fastest first. Nothing in the code says where the blocks run: EsaSim moves the files to the worker of the next block.
A block with an input that takes several connections
Make a worker block Compare workers:
- One input: id
results, label Results, type Metrics, formatjson, with several connections ticked. - One output: id
table, label Comparison, type Table, formatcsv.
import csv


def run(ctx):
    rows = []
    for f in ctx.inputs.get("results", []):              # one file per benchmark wired in
        r = f.read_json()                                # the benchmark's result.json
        rows.append({"block": f.from_node, "machine": r["machine"], "ops_per_second": r["ops_per_second"], "best_ms": r["best_ms"]})
    rows.sort(key=lambda r: r["ops_per_second"], reverse=True)
    if not rows:
        raise ValueError("Wire at least one CPU benchmark into Results")

    fastest = rows[0]["ops_per_second"]
    for r in rows:
        r["relative"] = round(r["ops_per_second"] / fastest, 3)   # 1.0 = the fastest

    with open(ctx.output("table", "comparison.csv"), "w", newline="") as f:
        w = csv.DictWriter(f, fieldnames=["block", "machine", "ops_per_second", "best_ms", "relative"])
        w.writeheader()
        w.writerows(rows)
return {"fastest": rows[0]["block"], "machines": len(rows)}ctx.inputs["results"]is a list with one entry per file that arrived: here oneresult.jsonper benchmark wired in. Each entry has.path(where the file is on this worker),.name,.size,.read_text(),.read_json(), and.from_node, the id of the block it came from.ctx.output("table", "comparison.csv")gives the path to write an output file; EsaSim collects it when the block ends.- Raising an error fails the block and the run, with the message in the log: better than an empty table that looks like a result.
Wire it and choose the workers
- In a new flow, add two CPU benchmarks (give them titles such as On Lab PC and On Laptop in the box at the top of their settings), Compare workers, and EsaSim's Table and Chart views.
- Wire both Result outputs into Results, and Comparison into the Table and the Chart. Set the chart to Kind
bars, Horizontal axismachine, Valuesops_per_second. - Press Run. Under Where each block runs, choose Change on each benchmark and pick a worker for each. Compare workers can go anywhere. Start.
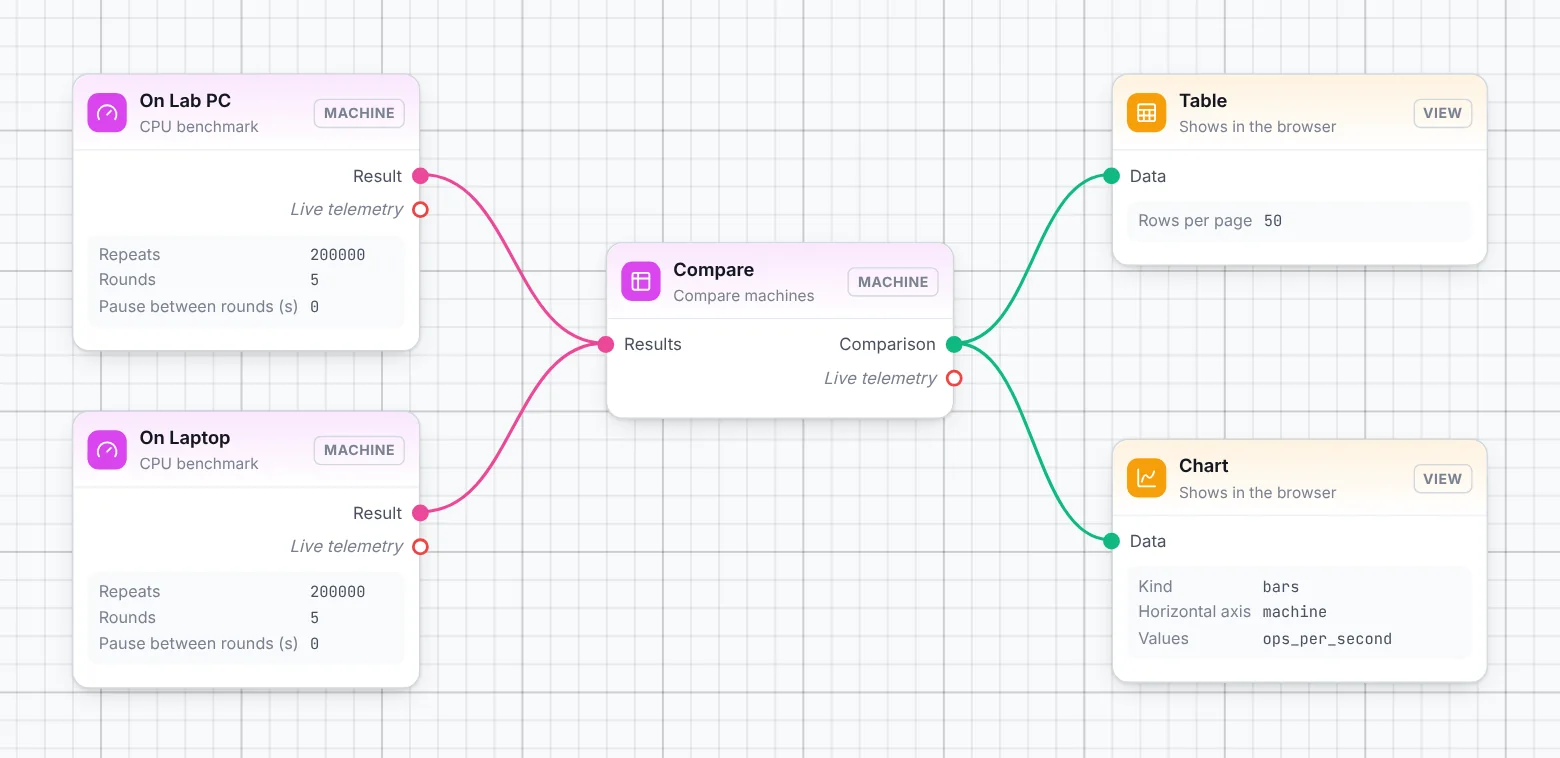
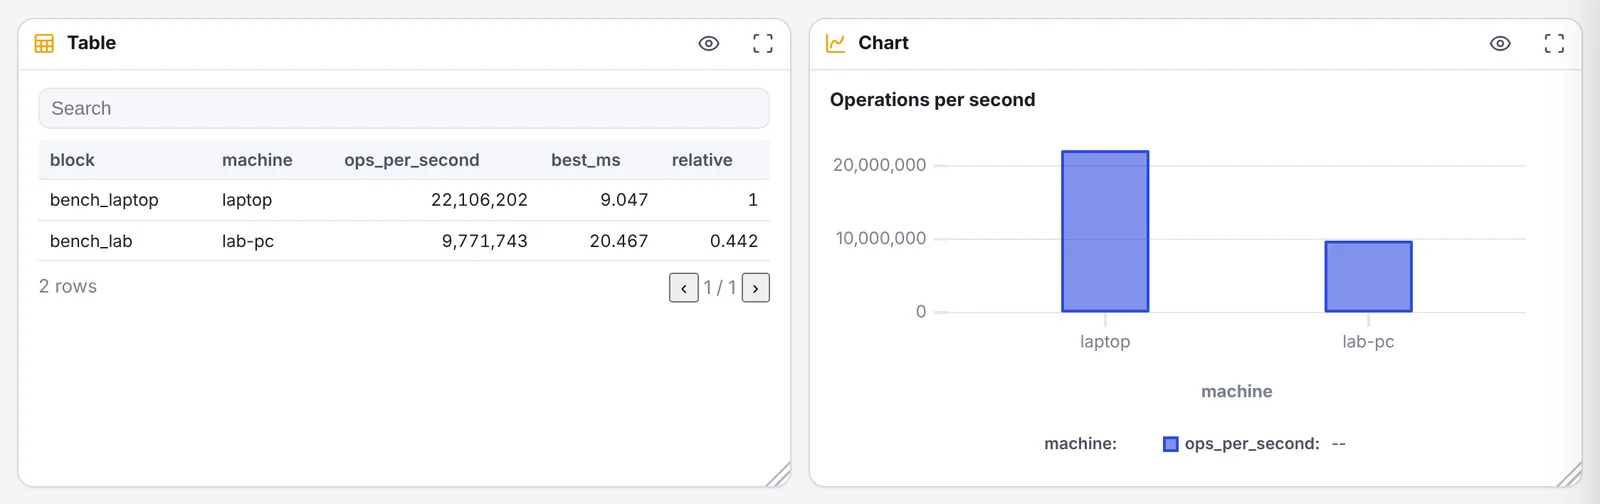
comparison.csv: no view code needed for tables and charts.The two benchmarks run at the same time, each on its worker. When both are done, the worker chosen for Compare workers receives both result.json files (from EsaSim, as they come from other workers), runs, and sends comparison.csv back; the views show it.
Where to go from here
- Use EsaSim's views where you can. Chart, Table, Metrics, Text, Images, Video and the 3D view draw tables, metrics, text, pictures and scenes in the formats of the port types. Write a view of your own when you need a display they do not have, or controls.
- Python packages. List the pip packages your code needs in the block's Python packages field (for example
numpy); the worker installs the missing ones before the block runs. - Bigger blocks. The rest of the block API, including parallel tasks, pictures sent live, AI models and views that start runs, is in Build your own blocks.
- Let an assistant write them. An AI assistant connected through MCP can make and wire blocks like these: describe the ports and what goes between them.
When something does not work
| What you see | What to check |
|---|---|
| The view stays on Waiting for the benchmark… after the run | The wire goes from Result (not Live telemetry) to the view; the run succeeded (a failed block sends no result); the input id in the code (ctx.json("bench")) is the id in the view's definition. |
| No live rounds | The view's input is of type Live values (stream) and is wired to Live telemetry; the channel name in the view is the one the block sends (round). The console's Live tab shows what the block sent. |
| Stop does nothing | The run is still going on (the button is disabled once it ends); the block reads the same channel the view sends on (control); the block checks ctx.messages inside its loop, not only at the start. |
| The run waits and never starts | A worker of the project is online and has Run code from projects on (Computing › the worker › Worker settings). |
| The block fails with a Python error | The log (console, Log tab) shows the error and the line. Fix the code in the code panel and run again: Apply changes this flow's copy only, saving the block in Projects > Blocks changes it for every flow. |