
Docs / Build
Blueprints
Build a flow from blocks on a grid, run it on your workers, and watch live telemetry and results on the View page, in charts, tables and the 3D view.
What a blueprint is
A blueprint is a flow of blocks connected by wires, drawn on a grid in a project's Blueprint tab. The tab opens straight into the editor, inside the project page: the main menu stays on the left (fold it to its icons with the button next to the logo) and the project's tabs stay above. A project can hold several flows; they are the tabs at the top left of the editor, with + to add one. The menu next to the open flow's name renames it, edits its description, duplicates it, saves it as a template or deletes it. Each block does one thing: read files, simulate, filter a table, ask an AI agent to review data, or show results. A wire carries the output of one block into the input of another; its colour tells the kind of data (files, table, items, 3D scene, metrics, text, live telemetry, model).
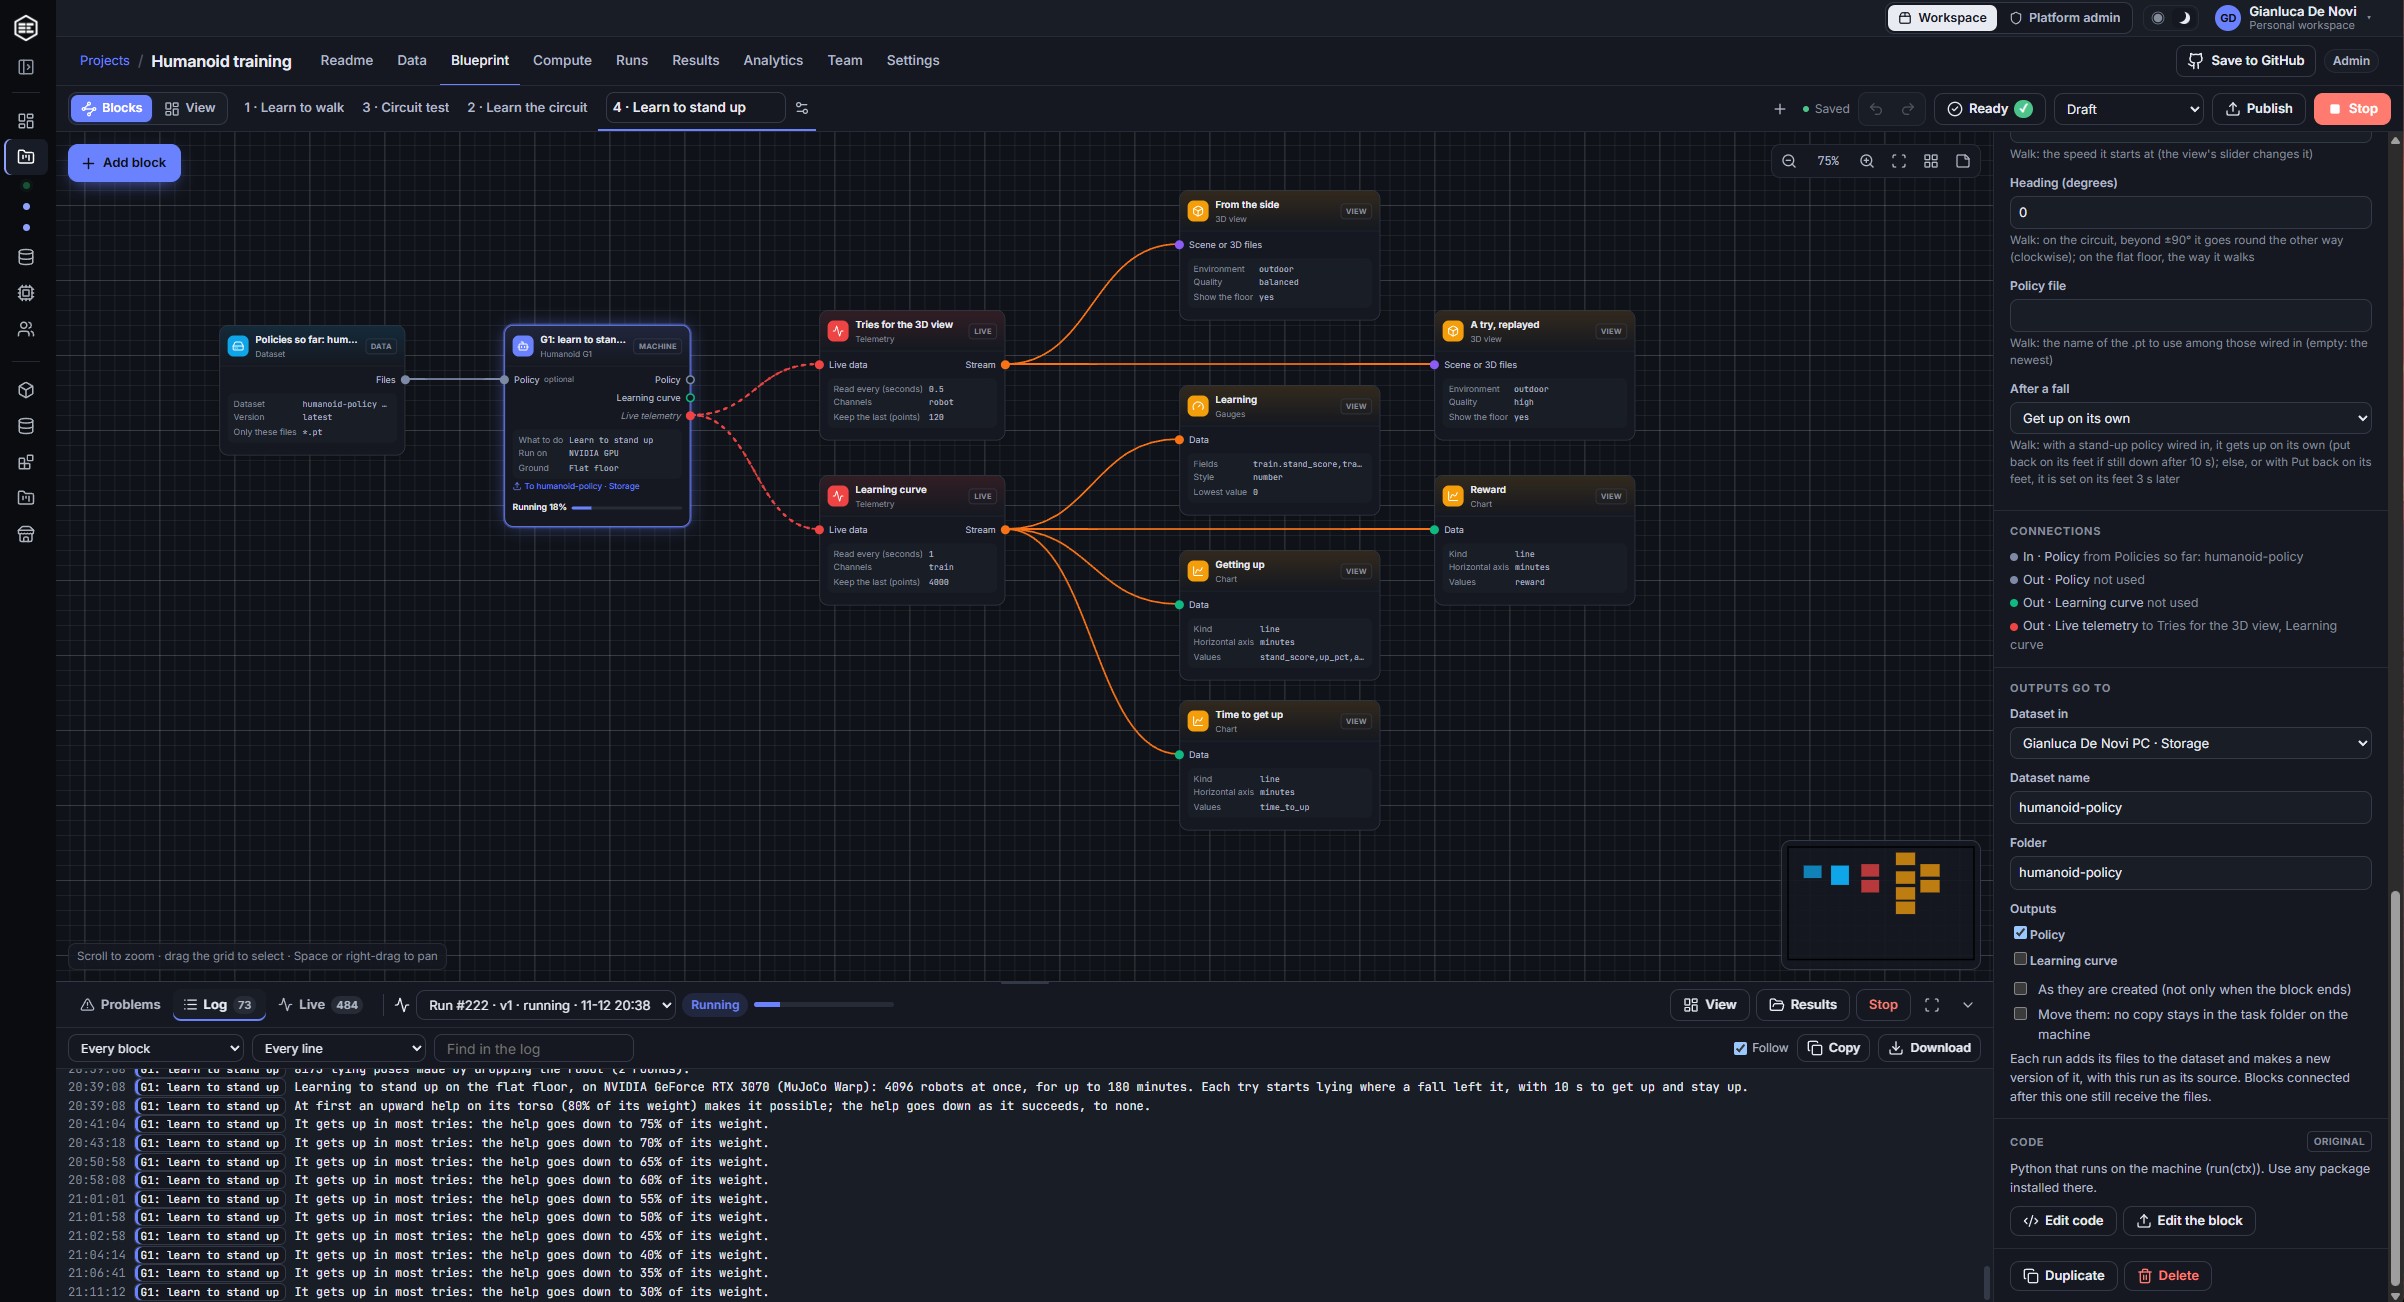
Blocks come in six kinds, shown on their card:
| Kind | Where it runs | Examples |
|---|---|---|
| Worker | On one of your workers, as a task of the run (Python) | Files on a worker, Landing sweep, 3D scene, Render, Python script, Agent |
| Data | Nowhere: the blocks wired to it read the dataset on the worker that holds it | Dataset |
| Library | Nowhere: workers download the chosen files before their block starts; views load them in the browser | Library |
| Settings | Nowhere on its own: its settings go to the block it is wired to | LLM |
| Live | In the browser: reads what running blocks report, every few seconds | Telemetry |
| View | In the browser, in a sandboxed frame | Chart, 3D view, Table, Metrics, Images, Video, Text |
Building a flow
- Press Add block (or
A): the block menu slides in from the left, with a search, a tab per category (Data, Simulation, Processing, AI, Devices, Telemetry, Visualizers, My blocks) and, beside the blocks, a column with what the chosen block does: its inputs, outputs, settings, where it runs and a link to its page in the block reference. Click a block to read about it, double-click it or press Add to flow to add it in the middle of the view, or drag it where you want it; arrow keys and Enter work from the search. The menu closes once a block is added. Double-click the grid to add a block right there. - Drag from an output port to an input port. Only inputs that accept that kind of data light up. Dropping a wire on empty grid opens a short list of blocks that fit.
- Blocks snap to the grid and show guides when they line up.
Ctrl+Ltidies the whole flow,Ffits it to the screen. - Select a block to change its settings on the right. Problems (an input not connected, a missing key) are listed there and in the console at the bottom, and the flow cannot run until the errors are fixed.
- Notes (
N) show who wrote them and when, and who changed them last, so a team can see who asked for what. Click inside a note to write in it. - The flow saves itself as you work. Publish keeps a numbered version that never changes; every run uses one, so results always say exactly what produced them.
- A published version can be put behind your own app: the project's API tab makes an endpoint of it, with an address and a key. See API endpoints.
- The project, with its blueprints, is saved to its GitHub repository a few seconds after each change; colleagues work on branches and merge through pull requests. See Working together on GitHub.
- An AI assistant connected to the workspace can build and change flows for you. See Build a study with an AI assistant.
Changing a block's code
Blocks marked with code can be opened with Edit code (or E). For a view, Code and Preview at the top switch between its code and the view drawn with sample data, each using the whole panel. Worker blocks are Python with a run(ctx) function; views are JavaScript with a render(ctx) function. Verify checks the syntax, the entry function and lists the Python packages the code imports, which must be installed on the workers that run it. A changed block is marked Changed in this flow; Back to original restores the shipped code. The panel scrolls, and you can widen it: drag its left edge (the width is remembered), double-click the edge or use the full-width button.
The ctx of a worker block gives its settings (ctx.params), its input files (ctx.inputs["port"]), paths for outputs (ctx.output("port", "name")), live values (ctx.telemetry("channel", data)), progress (ctx.progress(pct, "note")) and the connected model (ctx.llm). A view gets its data with ctx.input("port"), ctx.rows("port") and ctx.files, and the libraries ctx.THREE and ctx.uPlot.
Your own blocks
When the shipped blocks do not fit (a swarm planner, a detector of your own, a reader for your logs), make a block: Add block > Make a block in the editor, or Projects > Blocks > New worker block / New view. Give it a name, a category, an icon, its inputs and outputs with their types and formats, its settings and its code; Save block puts it in the block menu of every project of the workspace. Projects > Blocks lists the workspace's blocks with their versions, shares a block with the EsaSim library and saves copies to GitHub. See Build your own blocks.
Templates
From a flow's menu, Save as a template keeps its blocks, wires, settings and notes (API keys pasted in blocks are left out). Every project of the workspace then offers it under + (New flow). Whole projects can be templates too: see Projects.
Running a flow
- Press Run. The dialog shows the plan: which blocks run on workers, in what order, and which ones run in parallel.
- Choose where: Automatic sends each block to any worker of the project that fits, or pick one worker. Each worker shows whether it is available, busy or offline, and why it cannot run blueprints (an old worker, no Python 3, or Run code from projects turned off).
- If the draft changed since the last version, it is published first.
While it runs, each block shows its state and progress on the grid and the wires out of running blocks move.
The console
The console at the bottom of the Blocks page gathers everything that can go wrong. Its bar always shows the run shown (pick an earlier run in its list), its status, View (the View page, below), Results and Stop. Open it with its arrow, the ` key or the Ready / Problems button, drag its top edge to make it taller, or use its full-height button.
- Problems: the flow's own problems as you edit (an input not connected, a wrong value, formats that do not match), the checks of the workers and data before you run (no worker of the project has the accelerator a block needs, a worker too old for what the flow does, the workers that fit are offline or busy, data on a computer the project may not use), and the errors of the run shown. Click a block's name to find it on the grid.
- Log: every line the blocks print and EsaSim's own lines, live while the run goes on, each tagged with its block. Filter by block, by kind (errors and warnings, output, EsaSim) or by text; Follow keeps the newest line in sight; Download saves the whole log.
Every run is listed in the project's Runs tab, with its tasks and logs, and its files are in the Results tab.
The View page
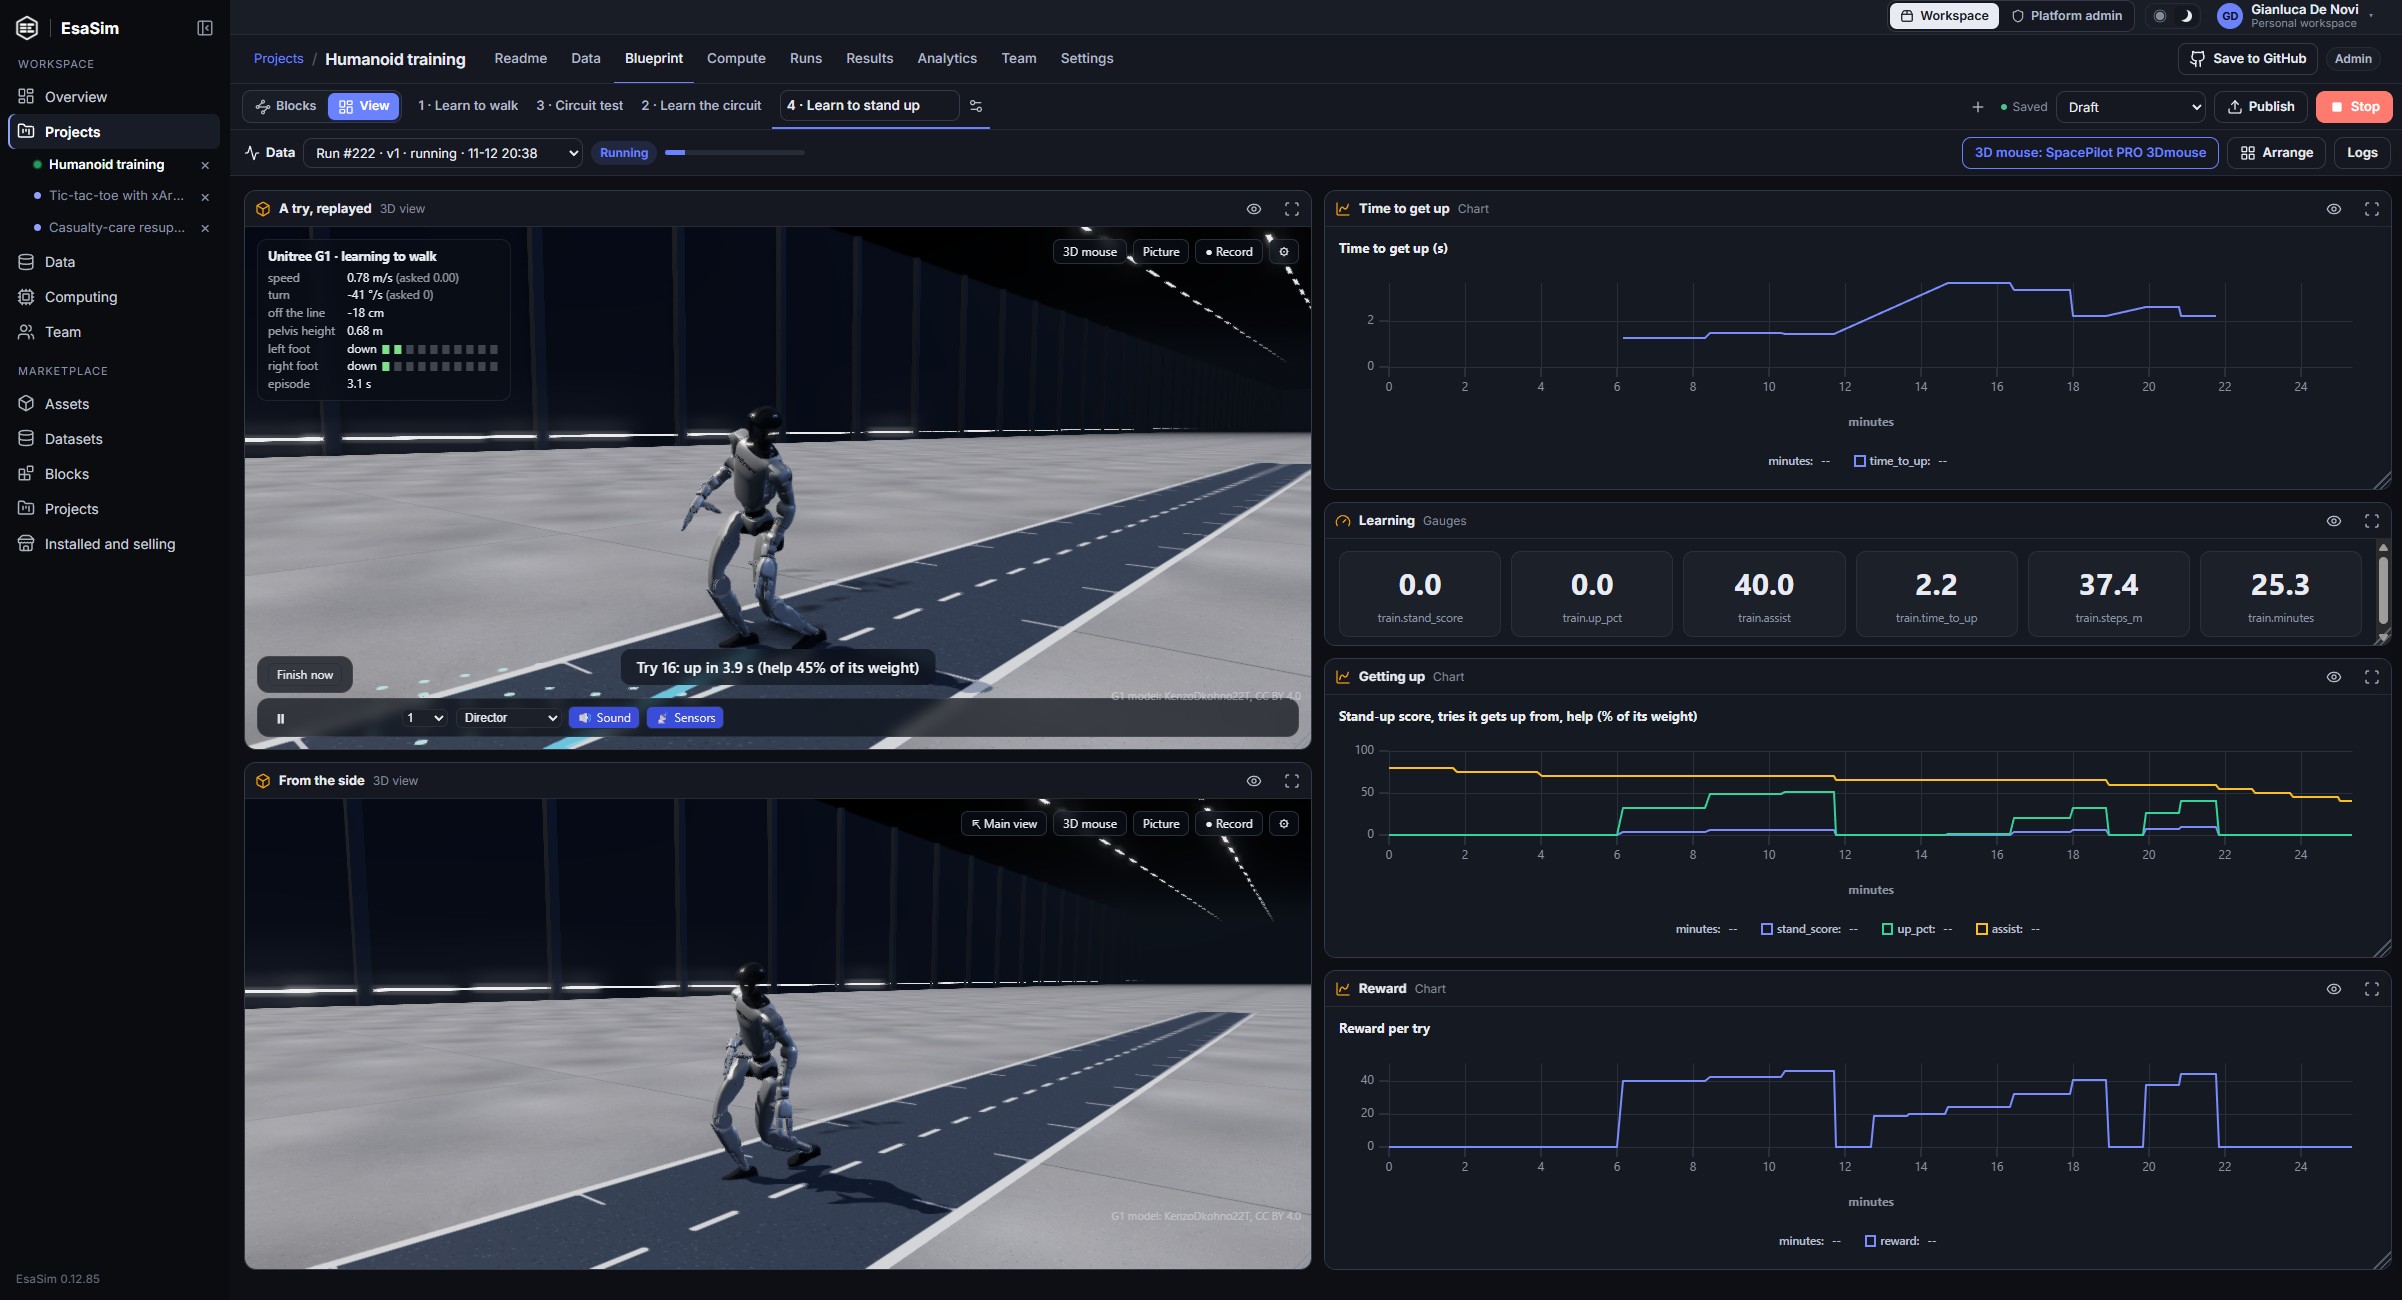
The editor has two pages, switched at the top left: Blocks, where you place and wire the blocks, and View, where the flow's results are shown together. Every block that shows something (Chart, 3D view, Table, Metrics, Images, Video, Video review, Review grid, Text, Gauges, Run timeline, Controls, or a view of your own) appears on the View page as soon as it is on the grid, and leaves it when it is deleted.
- Drag a view by its title to move it; the others make room. Drag its corner to resize it: some views only grow in width (Metrics) and each has a smallest size. Arrange places them all again in the order of the flow.
- The layout is saved with the flow, and kept in its versions and templates.
- Data chooses what the views show: a run of the flow (the latest one at first, live while it runs) or Sample data, made-up values to arrange the views before the first run. Files chosen in a Library block are shown in both.
- The eye icon shows the view's block on the Blocks page; the frame icon (or
Escto close) shows one view full size. On a phone, the views are one under the other.
Live telemetry
A worker block can send live values while it works (ctx.telemetry("channel", data), or ctx.picture for pictures): numbers, dicts, lists, chunks of audio or sensor samples, matrices. They reach the dashboard within about a second and show at once in the console's Live tab, with no wiring, filtered by block and channel. Wire the block's Live telemetry output straight into a view (Chart, Gauges, Heatmap, Waveform, Sound, Speak, Images, the 3D view…) and the view follows the run as it goes. A Telemetry block in between picks channels, keeps a number of points, or gathers several blocks into one view.
Talking to a running block
Views can send messages to the blocks of a running run: the Controls view (buttons, sliders, switches, text and choices), the Camera view (pictures and live frames of the camera of the computer you use), or ctx.send in your own views. A block reads them in Python with for m in ctx.messages("control"): …; they arrive within about a second. Messages are kept on EsaSim only until the block has read them, and a day at most.
Views and worker blocks for devices
| Block | What it does |
|---|---|
| Chart | Lines, areas, steps, points, bars and histograms, from tables or live values; zoom by dragging; Last points makes a scrolling live chart; a column of names (layouts, products…) on the horizontal axis gives one bar or point per name; t in seconds from the start of a run shows as minutes and seconds |
| Run timeline | How a run went: values over time with the run's events marked on them (incidents and their clearing as bands, with how long each took), the list of events, and tiles with the totals (duration, events, incidents and the time to clear them, averages and ranges, a KPIs file's fields); click an event to find it; Save events writes them as CSV. It works with any block that sends values and an events channel |
| Gauges | The latest value of each field as a dial, a bar or a large number, with warning and alarm levels |
| Heatmap | A matrix as colours, from a file or the newest one sent live |
| Waveform | Long signals (WAV, CSV, live sample chunks): zoom with the wheel, drag to move, an overview strip, Follow for live data, and Play |
| Sound | Plays audio files, live sample chunks, short sounds and beeps a block sends |
| Speak | Reads messages aloud with the browser's voices (text to speech) |
| Camera | The camera of the computer you use: pictures, videos, and frames sent to the running blocks |
| Controls | Buttons, sliders, switches, text and choices that send commands to the running blocks |
| Camera capture (worker) | Pictures or a video from a camera plugged into the worker (USB, built-in, rtsp://), with a live preview and commands |
| Network (worker) | HTTP requests, TCP and UDP messages, listening on a port, and a live bridge between the dashboard's messages and a device |
| xArm (worker) | Drives a UFactory xArm: status, home, moves, drawing with a pen (a tic-tac-toe grid, X and O), live commands; a dry run streams the poses without moving, and every target is checked against a safe box |
Views run in the browser, in a sandbox without network access: devices on your network are reached by worker blocks (Network, xArm, Camera capture), which run where the devices are.
An Images view shows pictures sent live (items with an image, such as the frames of the Render block on channel frame): the newest on top, with its number and progress.
The 3D view draws positions live: send items such as ctx.telemetry("pose", {"t": 1.25, "drone": [x, y, z], "pad": [x, y, z], "wind": 4.2}), with t the time in seconds and positions in metres (z up; add "up": "y" for y up). Bodies named like a drone are drawn as a quadrotor and a pad as a landing pad; others as spheres, or as your own model with Model for. The view plays them smoothly at real speed, a second or two behind the run, with trails, the head-up display (other numbers of the item are listed) and the follow camera. When the run's scene arrives, the view switches to the replay; Live and Replay in its bar switch back and forth. The Landing sweep does this by itself: with Live 3D on, its first task streams one landing at real speed (the Drone landing study template wires it).
The 3D view
Which model each object uses and which trajectory it follows is set in a 3D scene block, and a Render block renders the same scene on a worker into pictures and videos: see 3D scenes and rendering.
The 3D view shows positions live while a run goes on (see Live telemetry) and replays scenes: a ground, entities (a pad, a drone, or your own models) and runs with frames over time. It renders with physically based materials, soft shadows, sky lighting and filmic tone mapping. Use the timeline to play, pause and scrub, change speed, pick a run, follow the action (Follow rides behind the drone) or fit the view. It also loads glTF/GLB, OBJ, STL and PLY files (meshes, or point clouds drawn as points), and positions streamed live as {"name": [x, y, z]}.
3D mouse
A 3Dconnexion SpaceMouse flies the camera of the 3D view in six directions at once, in Chrome, Edge or Opera on a computer: choose 3D mouse in the view (or Connect a 3D mouse on the View page) and pick the device once; it reconnects by itself next time. The camera moves as the cap does, in its own frame: slide the cap left or right to move sideways, push it away or pull it toward you to fly forward or back, lift or press it to rise or sink; tilt it forward or back to pitch, tilt it sideways to roll, twist it to turn left or right. The camera keeps its roll until you drag with the mouse, choose Fit, or press the right button, which levels the horizon; the left button fits the view. The motion goes to the 3D view under the pointer. In the view's settings, 3D mouse speed makes it faster or slower and 3D mouse moves can switch to Move the scene (the scene follows the cap, as if you held it). The browser reads the device directly (WebHID); if 3DxWare is open in another tab, close it first.
Pictures and videos
Picture saves the view as PNG, JPEG or WebP. Record makes a video: What I see, in real time records the view as it plays, with your camera moves and its sound, until you press Record again, as MP4 (H.264, with AAC sound where the browser can encode it) or WebM (VP9 with Opus sound); the files are complete, with their duration and index, so any player opens and seeks them (browsers without WebCodecs fall back to their own recorder); The replay of this run, frame by frame renders every frame of the selected run, from its start to its end at the timeline's speed, whatever the speed of your computer, as MP4 (H.264), WebM (VP9) or PNG frames in a zip. ⚙ sets the format, the size (as the view, HD, Full HD, 1440p or 4K), the frames per second and the quality. When it is ready, download it or keep it in a dataset (EsaSim storage, a bucket, a drive or a worker's writable folder), in the folder you choose. Labels drawn over the scene are not in pictures and videos.
To use your own models in a scene, connect them to the same input as the scene, for example from a Library block: a model takes the place of the entity whose "model" names its file ({"id": "drone", "model": "quadcopter.glb", "size": 0.55}), or of the entity named in the setting Model for (for example drone), scaled to the entity's size. Other models stand next to the scene.
A scene file is JSON in the esasim.scene/1 format: entities (id, shape or model file, size, position, orientation), and runs, each with a label, the fields of its frames (for example t, drone.x, drone.y, drone.z, and drone.qx … drone.qw for its orientation) and the frames themselves. The 3D scene block and the Landing sweep write one; the format is described in 3D scenes and rendering.
Data in flows
The Dataset block brings a dataset of the workspace into a flow: choose it and its version (latest, or a number to repeat a run exactly) and, optionally, which files. Nothing is copied: the blocks wired to it receive the files where they are and are sent to the worker that holds them. Select files keeps the files a table chooses (for example those an Agent labelled keep), and Save as dataset writes the files it receives into a folder the worker shares, which EsaSim then indexes as a new dataset version that records the run and the datasets it came from. A dataset in EsaSim storage, a bucket or a cloud drive is downloaded by the computer that runs the next block, so any computer can use it (worker 0.8 or later).
Outputs go to, in the settings of any block that runs on a worker, sends its result files to a dataset in any connection (a folder on a worker, a bucket or a cloud drive): choose the dataset, the folder inside it and which outputs, and whether each file is sent as it is created and moved rather than copied. The node shows where its files go, and the dataset gets a new version when the block ends. See Data and datasets.
The Library block brings files of the EsaSim library (free test data: 3D models, pictures, videos, logs, tables) into a flow. Choose files opens the library by collection and kind; the chosen files go to every block wired to it. A worker block finds them in its input like any other file (ctx.inputs["in"]), downloaded before it starts; a view loads them in the browser, with a run or with sample data.
Python on the worker, or Docker
Each worker runs blocks with its own Python, or in Docker: one container per block, with the image chosen in its Worker settings (for example a PyTorch image), the run's folder mounted, and the shared folders mounted read-only unless blocks may write there. Docker gives every worker, and EsaSim Cloud, the same environment; Python is simpler on a workstation.
Security
- Worker blocks run on your workers only if the worker's Run code from projects setting is on (Computing > your worker > Worker settings). What that code does on your worker is your decision, as with any script you run.
- Views run in a sandboxed frame without network access and without your session: they receive only the data of the run they show, and the files of the EsaSim library chosen in a Library block.
- API keys pasted in a block are stored encrypted in the workspace, never shown again, and sent only to the worker that runs the block, as environment variables.
- Some keys can live in your profile instead (Profile > Keys: a Hugging Face token). Saved once there, it works in every block that takes it: when you run a flow, a block left without a key of its own uses the key of the person who runs it, so each person runs with their own. A key pasted in a block (A key for this block only) comes first.